


Design firms report healthy demand and record margins, but thinner backlog growth and weakening construction spending complicate the outlook for new work
PSMJ Resources’ latest measure of architecture and engineering proposal activity remains firmly positive, but slowing backlogs and weakening construction spending complicate the signal it sends about the work ahead.
ENR was provided an advance copy of the firm’s second-quarter Quarterly Market Forecast, scheduled for release around Aug. 19. Based on responses from 290 AEC executives collected July 6-23, the report puts PSMJ’s Net Plus/Minus Index for proposal activity at +23.4, compared with +20.4 a year earlier. All 11 client markets tracked by PSMJ remained positive, led by energy and utilities at +59.6, water and wastewater at +44.6 and heavy industry at +41.9.
“Proposal activity is a good early indicator of trouble but also of opportunity,” says Gregory Hart, president of Newton, Mass.-based PSMJ. “The infrastructure and energy markets are doing quite well right now.”
Read More
PSMJ — 2026 Financial Performance Benchmark Results
Construction spending looks less buoyant. Census Bureau data compiled by Associated General Contractors of America show total construction spending fell 3.2% from June 2025 to June 2026 in current dollars. Private nonresidential spending declined 4.7%, while public construction spending increased 1.7%, down from 7.3% growth during the preceding 12-month period.
Ken Simonson, AGC chief economist, says private nonresidential spending has steadily decelerated for two years and has been declining year over year for the past 12 months. Public spending is still increasing, he says, “but at a much slower rate than one and two years ago.”
The Census construction-spending figures are not inflation-adjusted. Producer price index data released Aug. 13 by the U.S. Bureau of Labor Statistics show prices for inputs to new nonresidential construction were 7.1% higher in July than a year earlier. Simonson cautions against directly matching a particular month’s material prices to spending on projects that bought materials at different times, but says persistent price increases suggest even public construction spending is declining when measured by the amount of construction being put in place.
That backdrop gives PSMJ’s proposal numbers another possible reading.
Looking for quick answers on construction and engineering topics?
Try Ask ENR, our new smart AI search tool. Ask ENR →
“Proposal activity is hard to interpret,” Simonson says. “It may be a sign that more firms are bidding projects they might have ignored had their order books been plumper.” He nevertheless says PSMJ’s results are broadly consistent with government data and what he is hearing and reading about the market.
Backlog Growth Slows
PSMJ’s own financial benchmarking data show those order books are not growing as quickly as they were. Its 2026 AE Financial Performance Benchmark Survey, released in July, found median backlog growth among 318 participating firms slowed to 5% from 11.1%. Backlog as a share of annual net revenue declined to 92.6% from 103.8%, while net revenue growth eased to 9.5% from 10%.
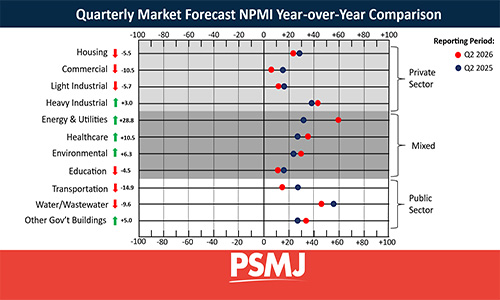
AEC proposal activity remained positive across all 11 markets tracked by PSMJ in the second quarter, led by energy and utilities, while transportation and water/wastewater weakened from year-earlier levels.
Graph courtesy of PSMJ
The survey largely reflects year-end 2025 financial conditions. PSMJ cautions that participating firms can change from year to year, so annual comparisons indicate broader trends rather than technically apples-to-apples measurements.
Hart says backlogs are “not at the record levels or at the even higher levels we saw a year ago, but still quite strong.” He points to pent-up infrastructure needs and state and local work as sources of demand as the Infrastructure Investment and Jobs Act funding surge moves beyond its peak.
Transportation data from both organizations show some of that moderation. PSMJ’s transportation proposal index remained positive in the second quarter but fell 14.9 points from a year earlier. Census data show transportation construction spending up 2% year over year in June, including a 2% increase for air transportation, while private rail and truck facilities fell 4% and transit construction declined 6%.
Simonson says airport work has kept transportation spending positive, though growth has slowed substantially. He also sees further risk as IIJA approaches expiration and prospects for timely successor infrastructure legislation and the next Water Resources Development Act remain uncertain.
Water offers another contrast. PSMJ’s +44.6 proposal reading makes water and wastewater its second-strongest current market. Census figures show sewage and waste-disposal construction down 2% from a year earlier and water-supply spending up 0.9%. Simonson says both had been increasing at double-digit rates until recently.
Energy presents a closer match between the indicators. PSMJ’s +59.6 reading made energy and utilities its strongest proposal market, while Census data show power construction spending up 4% from June 2025. Simonson also points to robust electric power generation and battery storage spending as current areas of strength.
Firms Hold on to Pricing Power
The slower backlog growth has yet to show up in design-firm margins. PSMJ’s financial survey found median operating profit before bonuses and taxes reached 20.5% of net revenue, up from 19% in the previous survey and the highest in its historical series.
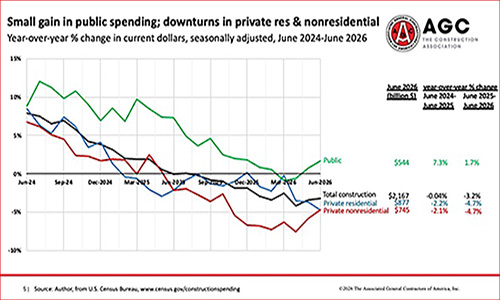
Construction spending weakened through June, with private nonresidential spending down 4.7% year over year while public construction growth slowed to 1.7%, according to Census Bureau data compiled by AGC. Click to enlarge.
Graph courtesy of AGC
Those gains came as labor became more expensive. Direct labor costs per hour rose 5%, while total hourly costs increased 4%. PSMJ’s median achieved direct labor multiplier—the net revenue generated for each dollar of direct project labor—rose to 3.43 from 3.37, exceeding firms’ median target of 3.29.
“I think firms are getting a lot better at pricing their work,” Hart says. Several years of wage inflation have prompted higher rates and target labor multipliers, while heavier backlogs have allowed firms to become more selective about the clients and projects they pursue. He also points to greater use of lump-sum contracts and growing emphasis on “value-based pricing and value-based thinking and value-based selling.”
Labor pressure is also visible on the construction side. Average hourly earnings for construction production and nonsupervisory workers increased 5.2% from July 2025 to July 2026, compared with 3.2% across the private sector, according to BLS data compiled by AGC.
RELATED
ENR 2026 Top 500 Design Firms: AI Boom Buoys Design Revenue
Design firms expanded their workforces while producing more revenue and profit per employee. PSMJ reported median staff growth of 7.4%, up from 5% in the previous survey. Net revenue per employee increased 3% to $195,224, while operating profit per employee rose 13% to $38,881.
“Firms have been kind of forced to get more efficient” as strong demand runs into persistent talent shortages, Hart says. Project managers without efficiency improvements end up handling what he calls “ridiculous numbers of projects,” while schedules are being compressed. He says AI is producing some individual productivity gains but remains too new to materially affect project financial performance.
Simonson sees the broader construction economy remaining uneven. AGC’s August outlook identifies data centers, power, airports and specialty health care as the best bets for growth, while forecasting continued declines in warehouse and office work and describing the medium-term outlook as slow growth with a risk of stalling and higher prices.
Hart expects design-firm financial metrics to remain relatively stable over the next year, with some potential for margins and direct labor multipliers to edge higher.